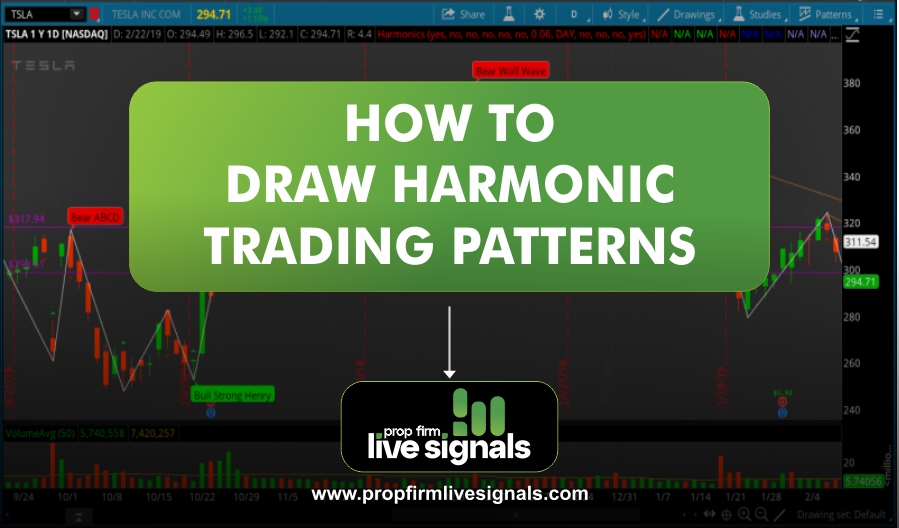
The concept of harmonic trading was introduced by H.M. Gartley in the 1930s and later refined by Scott Carney and other traders. These patterns have gained popularity due to their effectiveness in predicting price movements across different financial markets, including forex, stocks, and cryptocurrencies. By understanding how to draw harmonic trading patterns correctly, traders can improve their accuracy, reduce false signals, and enhance their overall strategy.
Harmonic trading patterns are composed of specific geometric price formations that follow predefined Fibonacci levels. The most common patterns include the Gartley, Bat, Butterfly, Crab, and Cypher patterns. Each of these patterns has unique Fibonacci measurements that traders must identify to determine potential reversal zones. Mastering the art of drawing harmonic patterns requires patience, precision, and a deep understanding of market structure.
What Are Harmonic Trading Patterns?
Harmonic trading patterns use geometric price structures combined with Fibonacci ratios to determine potential reversal points in the market. Unlike traditional technical analysis, harmonic patterns rely on fixed ratios rather than subjective interpretations. The concept of harmonic trading was developed by Scott Carney and further refined by other traders.
Types of Harmonic Trading Patterns
There are several well-known harmonic trading patterns, including:
1. Gartley Pattern
The Gartley pattern consists of five points: X, A, B, C, and D. The pattern follows specific Fibonacci levels:
- XA: Initial leg
- AB: Retraces 61.8% of XA
- BC: Retraces 38.2% to 88.6% of AB
- CD: Extends 127.2% to 161.8% of BC
- D: The reversal point
Traders look for confirmation signals like RSI divergence or bullish/bearish engulfing candlesticks before entering a trade.
2. Bat Pattern
The Bat pattern is similar to the Gartley but has deeper retracements:
- AB: Retraces 38.2% to 50% of XA
- BC: Retraces 38.2% to 88.6% of AB
- CD: Extends 161.8% to 261.8% of BC
This pattern offers a tighter stop-loss and higher risk-reward ratio compared to other harmonic setups.
3. Butterfly Pattern
The Butterfly pattern differs from the Gartley and Bat by having an extended CD leg:
- AB: Retraces 78.6% of XA
- BC: Retraces 38.2% to 88.6% of AB
- CD: Extends 127.2% to 161.8% of XA
Butterfly patterns usually indicate strong trend reversals and should be confirmed with volume analysis.
4. Crab Pattern
The Crab pattern has the deepest extension on the CD leg:
- AB: Retraces 38.2% to 61.8% of XA
- BC: Retraces 38.2% to 88.6% of AB
- CD: Extends 224% to 361.8% of BC
This pattern is highly volatile and requires precise risk management.
5. Cypher Pattern
The Cypher pattern is slightly different:
- AB: Retraces 38.2% to 61.8% of XA
- BC: Extends 113% to 141.4% of AB
- CD: Retraces 38.2% to 78.6% of XC
Steps to Draw Harmonic Trading Patterns
Step 1: Identify the XA Leg
The first step in drawing harmonic patterns is recognizing the first impulse wave (XA). This leg represents the initial market move.
Step 2: Measure Fibonacci Retracement for AB
Use the Fibonacci retracement tool to check if the next movement (AB) follows harmonic levels.
Step 3: Identify BC Leg
Measure the retracement level of BC based on AB. The level must align with specific Fibonacci ratios for the pattern to remain valid.
Step 4: Determine CD Completion
Extend the BC leg using Fibonacci projections to find the potential reversal zone (PRZ) at point D.
Step 5: Confirm with Additional Indicators
Before entering a trade, confirm the pattern using:
- RSI (Relative Strength Index)
- MACD (Moving Average Convergence Divergence)
- Candlestick patterns
- Volume analysis
Step 6: Set Stop-Loss and Take-Profit Levels
Once a valid harmonic pattern is identified, traders should place stop-loss orders beyond the PRZ to protect against false breakouts. Profit targets should align with Fibonacci extensions of the CD leg.
Common Mistakes in Drawing Harmonic Patterns
- Ignoring Fibonacci Levels: Patterns must strictly follow Fibonacci ratios.
- Forcing Patterns: Avoid trying to fit price movements into a pattern.
- Lack of Confirmation: Always use additional indicators for validation.
- Poor Risk Management: Without a proper stop-loss, a failed pattern can lead to significant losses.
Tips for Improving Harmonic Trading Accuracy
- Use Multiple Timeframes: Confirm patterns across different timeframes.
- Combine with Trend Analysis: Align patterns with overall market trends for better accuracy.
- Practice on Historical Data: Backtest patterns before using them in live trading.
- Stay Updated on Market Conditions: Economic events can impact pattern outcomes.
Conclusion
Harmonic trading patterns provide traders with an effective way to identify precise entry and exit points based on Fibonacci ratios. By learning how to properly draw and validate these patterns, traders can significantly improve their trading accuracy and profitability.
If you’re new to harmonic trading, start by practicing with a demo account and refining your ability to spot valid patterns. Over time, with discipline and experience, you can master this advanced trading technique.
Frequently Asked Questions (FAQs)
What is the best timeframe for harmonic trading patterns?
Harmonic patterns work on all timeframes, but they are most effective on 1-hour, 4-hour, and daily charts.
Are harmonic patterns accurate?
Yes, when used correctly, harmonic patterns have a high accuracy rate, especially when combined with other technical indicators.
Do harmonic patterns repaint?
No, once a harmonic pattern completes, it does not repaint. However, incorrect measurements can lead to false setups.
Can beginners use harmonic trading patterns?
Yes, but they require practice. Beginners should first understand Fibonacci tools and basic technical analysis before applying harmonic patterns.
How do I confirm harmonic patterns before trading?
Traders confirm harmonic patterns using Fibonacci confluence, RSI divergence, candlestick confirmations, and volume analysis.
Can harmonic patterns be used in crypto trading?
Yes, harmonic patterns work well in crypto markets due to the volatility and technical nature of price movements.
What are the best tools for drawing harmonic patterns?
Popular tools include TradingView, MetaTrader, and Harmonic Pattern Scanner software.
What is the difference between harmonic patterns and traditional chart patterns?
Harmonic patterns rely strictly on Fibonacci ratios for identification, while traditional patterns like head and shoulders or double tops/bottoms are more subjective.
What are the risks of trading with harmonic patterns?
The main risks include misidentification of patterns, failure to confirm signals, and poor risk management, leading to potential losses.
Can harmonic patterns be used for scalping?
Yes, but they are more effective for swing trading and longer-term setups. Scalpers may need to adjust risk-reward strategies accordingly.


